Amidst the swirling speculations and ever-evolving crypto landscape, recent rumors of a potential Bitcoin ETF approval have ignited a fervor in the trading community.
With Bitcoin’s daily trading volume soaring past the $20 billion mark, many market analysts and enthusiasts are left wondering if this surge heralds the inception of a new bull market.
ETF Rumors Send Daily Trading Volume Flyrocket
An intriguing event that briefly electrified the crypto community was the propagation of a false rumour about a potential Bitcoin ETF approval in the US.
Originating from the “X account” of crypto media giant Cointelegraph, this rumor sparked a sharp $2,000 ascent in Bitcoin’s price.
This sudden spike also caused massive volatility across the board, leading to liquidations exceeding $100 million within an hour.

However, BlackRock later confirmed that the SEC had not sanctioned its Bitcoin ETF application. The initial rumor-spreading tweet was promptly rectified and deleted.
Recent delays by the SEC on BlackRock’s ETF application have now pushed the final decision into January of the following year.
Notably, analysts from Bloomberg, James Seyffart and Eric Balchunas, estimated a 75% probability of a spot Bitcoin ETF approval by the end of 2023.
However, they quickly clarified that the rumour on that particular Monday morning lacked tangible evidence.
Bitcoin Price
As of October 17th, Bitcoin (BTC/USD) presents an optimistic trajectory, priced at $28,557. Within a 24-hour timeframe, this premier digital currency has witnessed its trading volume rocket to a staggering $15 billion, resulting in a price increment of 0.75%.
Sitting proudly at the top rank on CoinMarketCap, Bitcoin’s market capitalization is an awe-inspiring $557.36 billion.
The current circulation in the market stands at 19.5 million BTC coins, nearing its ultimate cap of 21 million.
Bitcoin Price Prediction
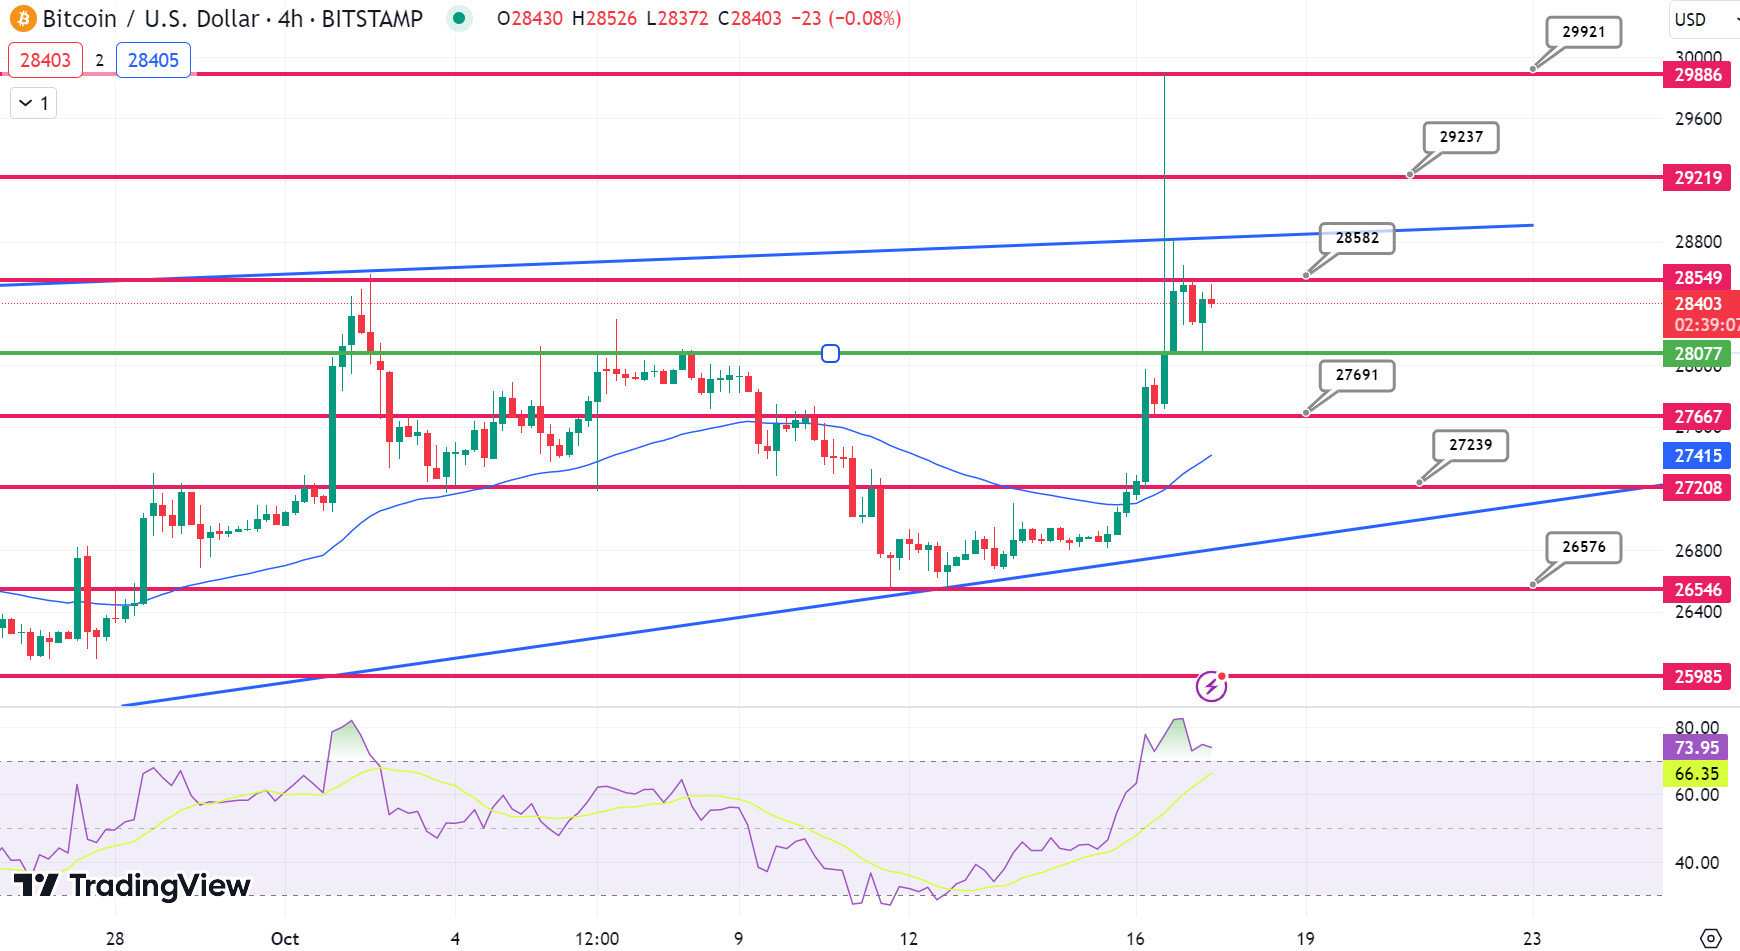
At the heart of the chart lies the pivot point valued at $28,077, serving as a fundamental price marker.
Looming ahead is an immediate resistance level at $28,549, closely followed by subsequent resistances at $29,219 and $29,886.
On the flip side, Bitcoin finds its immediate support at $27,667, with further cushions at $27,208 and $25,985.
Shifting the focus to technical indicators:
The RSI, or Relative Strength Index, currently marks a value of 74. This metric indicates that Bitcoin is potentially treading in overbought territories.
While an RSI above 50 usually signals a bullish momentum, the current elevated value calls for traders’ caution, considering its proximity to the overbought boundary.

Concurrently, the 50-day Exponential Moving Average (50 EMA) is pinned at $28,077, reinforcing the pivot point’s importance. The price trajectory of Bitcoin comfortably surpasses the 50 EMA, signifying a prevailing short-term bullish stance.
Additionally, the chart patterns bring forth some intriguing revelations. The 4-hourly trendline for Bitcoin suggests a resistance barrier close to the $28,600 mark.
The emergence of neutral candle patterns underscores a sense of indecision within the investor community.
It’s conceivable that many are biding their time, possibly in anticipation of more definitive fundamental signals before committing to their next move.
Top 15 Cryptocurrencies to Watch in 2023
Stay up-to-date with the world of digital assets by exploring our handpicked collection of the best 15 alternative cryptocurrencies and ICO projects to keep an eye on in 2023.
Our list has been curated by professionals from Industry Talk and Cryptonews, ensuring expert advice and critical insights for your cryptocurrency investments.
Take advantage of this opportunity to discover the potential of these digital assets and keep yourself informed.
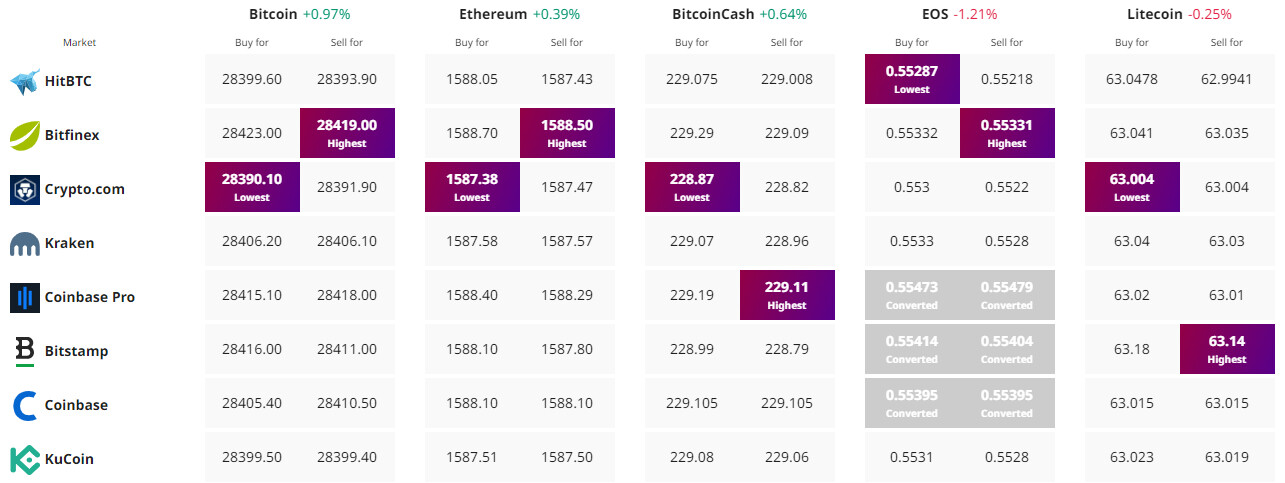
Find The Best Price to Buy/Sell Cryptocurrency

Disclaimer: Cryptocurrency projects endorsed in this article are not the financial advice of the publishing author or publication – cryptocurrencies are highly volatile investments with considerable risk, always do your own research.


![https://primexbt.investments/start_trading/?cxd=459_549985&pid=459&promo=[afp7]&type=IB](https://tradinghow.com/wp-content/uploads/2025/02/primexbt-markets-e1738588646201.jpg)
![https://primexbt.investments/start_trading/?cxd=459_549985&pid=459&promo=[afp7]&type=IB](https://tradinghow.com/wp-content/uploads/2025/02/primexbt-markets.jpg)
![https://primexbt.investments/start_trading/?cxd=459_549985&pid=459&promo=[afp7]&type=IB](https://tradinghow.com/wp-content/uploads/2025/02/PrimeXBT-Trading.jpg)


